Powertools for AWS Lambda (3) - Tracing
Table of Contents
AWS X-Ray helps developers analyze and debug distributed applications by providing a holistic view of requests as they travel through the system.1 Tracer is a wrapper around the AWS X-Ray SDK for Python that offers a simplified interface for instrumenting Lambda functions.2 In this post, I will show you how to use Tracer to gain insights into your function’s execution.
The complete source code for this example is available in this GitHub repository.
#
Installing Powertools for AWS Lambda Tracer
To use the Tracer utility, we need to install the tracer extra.
uv add "aws-lambda-powertools[tracer]"
#
Tracing
The following example demonstrates how to instrument a Lambda function with Tracer. The full implementation is available in lambda/app.py.
import json

from aws_lambda_powertools import Tracer
from aws_lambda_powertools.utilities.typing import LambdaContext

# A
tracer = Tracer()

# B
@tracer.capture_method
def calculate_total_cost(amount: int, price: float) -> float:
    return amount * price

# C
@tracer.capture_lambda_handler
def lambda_handler(event: dict, context: LambdaContext) -> dict:
    # ...

    total_cost = calculate_total_cost(amount=5, price=20.0)

    # D
    tracer.put_annotation(key="order_id", value=order.order_id)
    tracer.put_metadata(key="order_details", value=order.model_dump())

    return {"statusCode": 200, "body": "..."}

    # ...
##
A. Initializing the Tracer
The Tracer instance serves as the entry point for all tracing operations.
The @tracer.capture_method decorator instruments the calculate_total_cost function. This creates a custom subsegment in the trace, allowing you to measure the performance of specific code blocks independently.
The @tracer.capture_lambda_handler decorator instruments the main handler. It automatically captures the Lambda invocation, records cold start status, and handles service exceptions.
tracer.put_annotation: Records key-value pairs that are indexed for search and filtering. Annotations allow you to group traces and quickly locate specific transactions (e.g., byorder_id).tracer.put_metadata: Attaches additional, non-indexed data to the trace segment. Metadata is ideal for storing detailed context, such as entire objects or lists, which are useful for debugging but not needed for search queries.
Finally, to enable tracing infrastructure-side, we must set tracing_mode to Active in terraform/lambda.tf. We also define POWERTOOLS_SERVICE_NAME to identify our service in the X-Ray console.
resource "aws_lambda_function" "lambda" {
  ...
  tracing_config {
    mode = "Active"
  }
  environment {
    variables = {
      POWERTOOLS_SERVICE_NAME = "order-service"
      # ...
    }
  ...
}
#
Deploying and Testing
Deploy the function using the standard Terraform workflow (terraform init, terraform apply). After deployment, go to the AWS Lambda console and trigger the function with these test events rapidly, one after the other (e.g., within a minute).
{
  "order_id": "101",
  "item": "Coffee",
  "amount": 1,
  "price": 4.50
}
{
  "order_id": "102",
  "item": "Coffee",
  "amount": 3,
  "price": 4.50
}
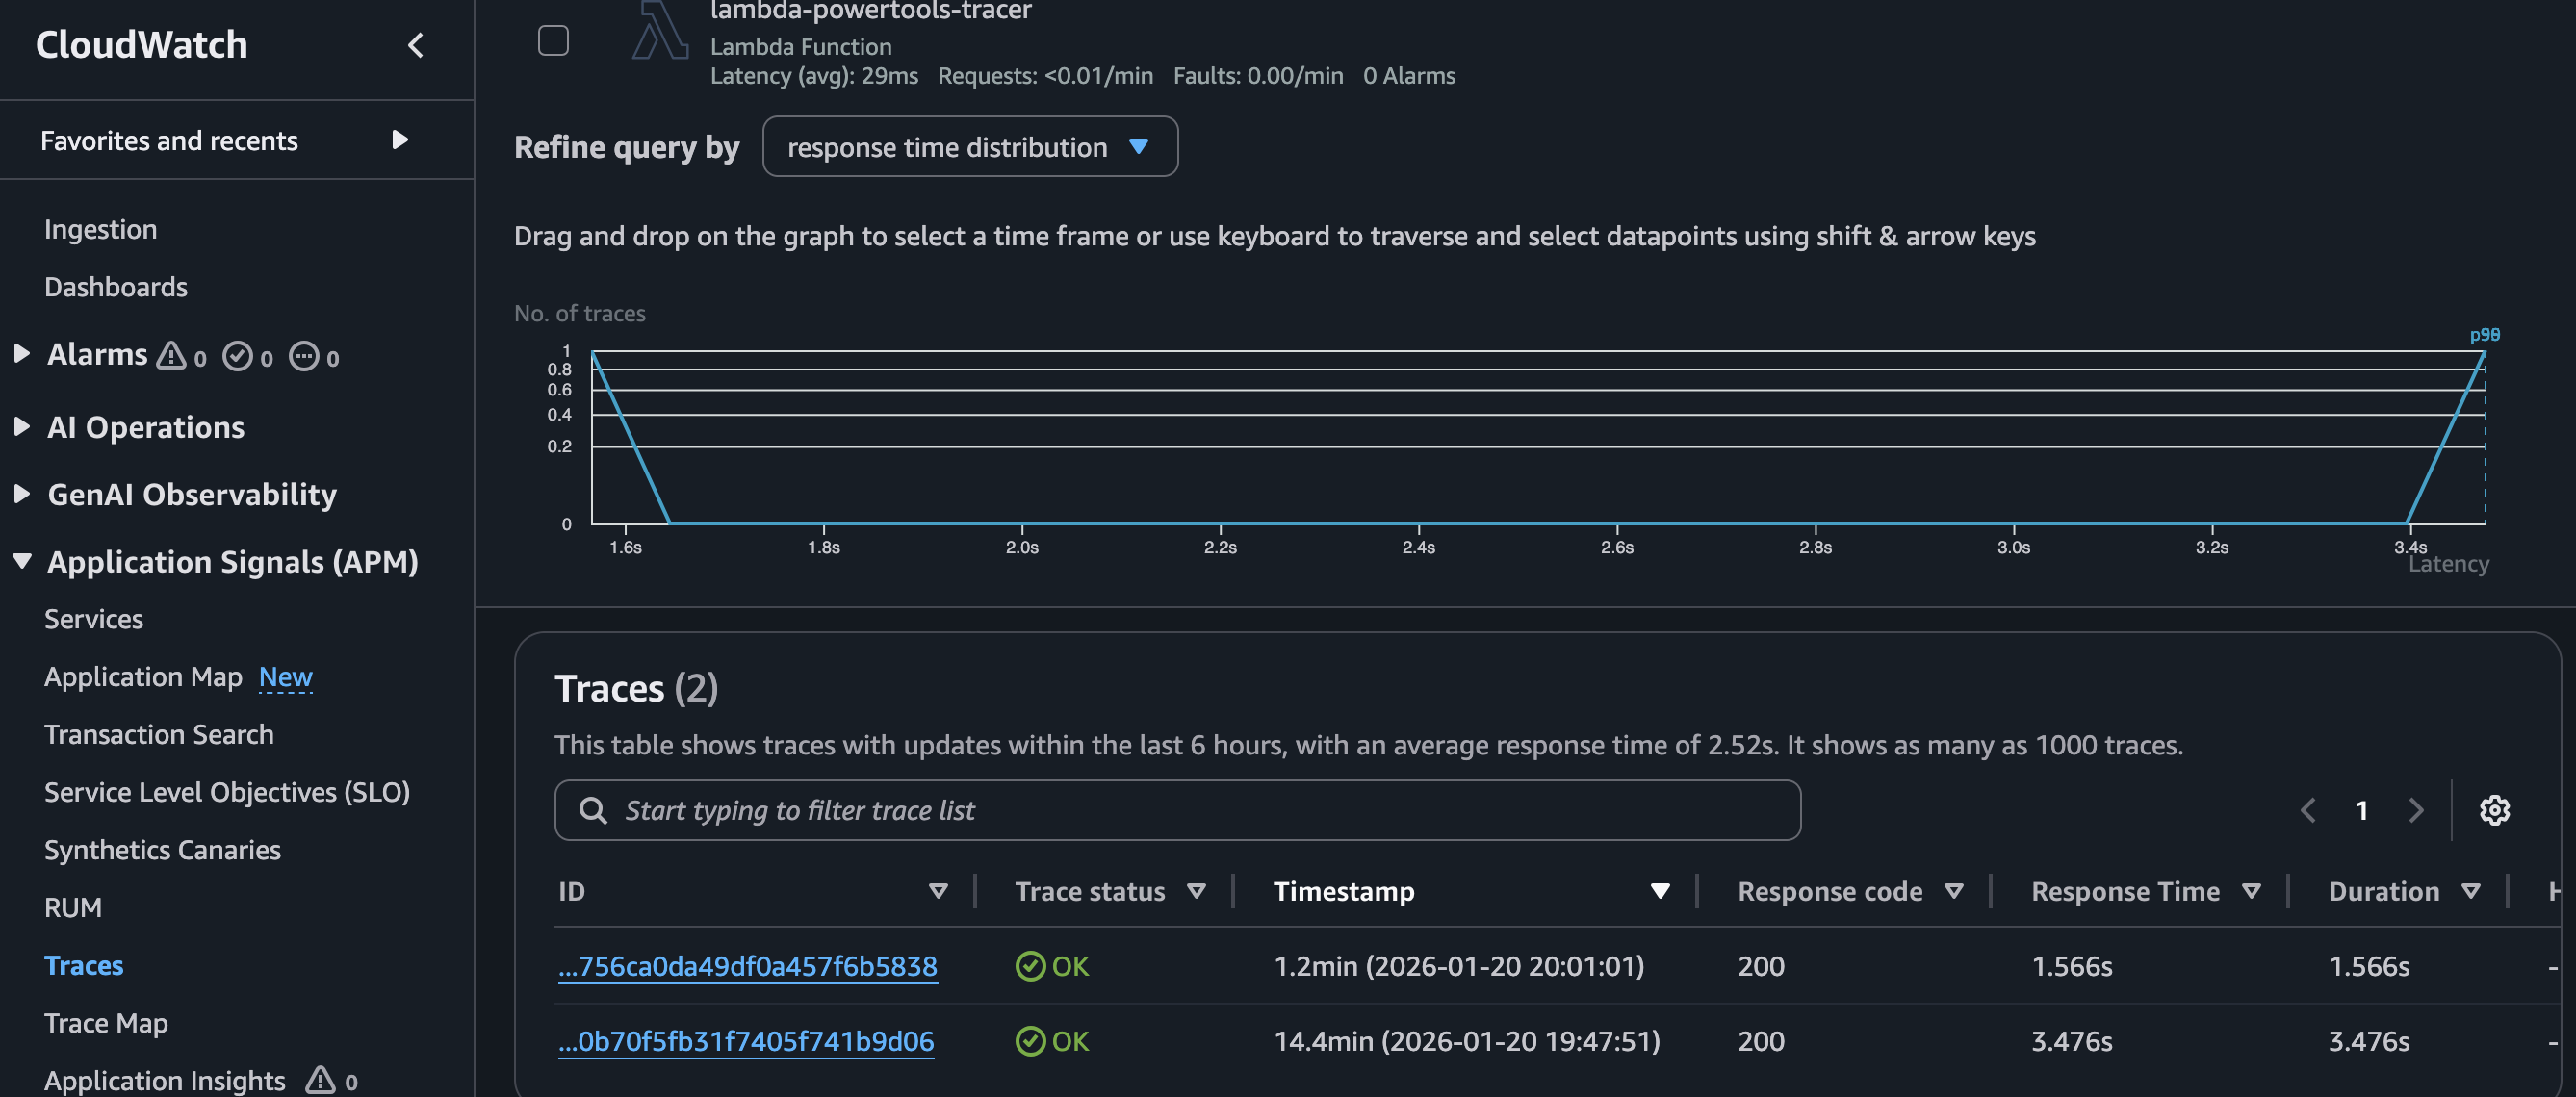
Navigate to the Traces tab in the CloudWatch Console. You should see two traces corresponding to the two test events.
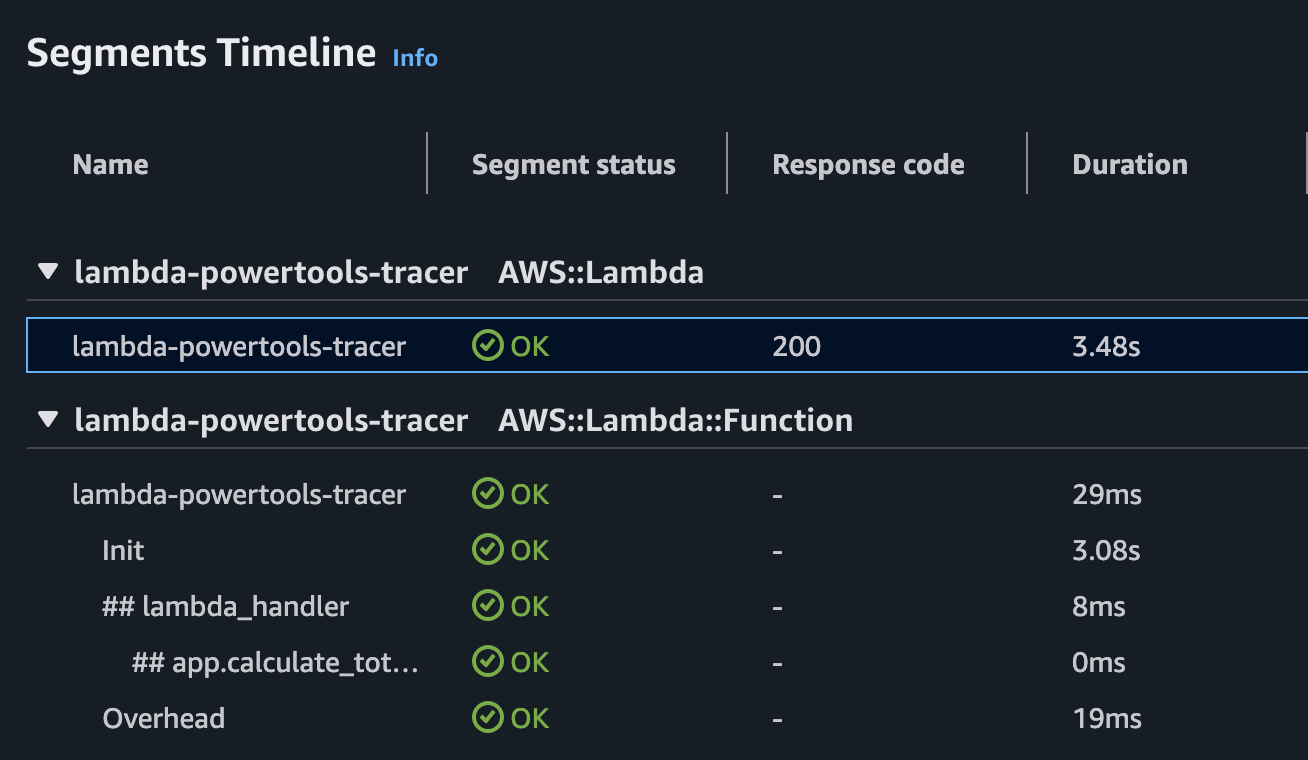
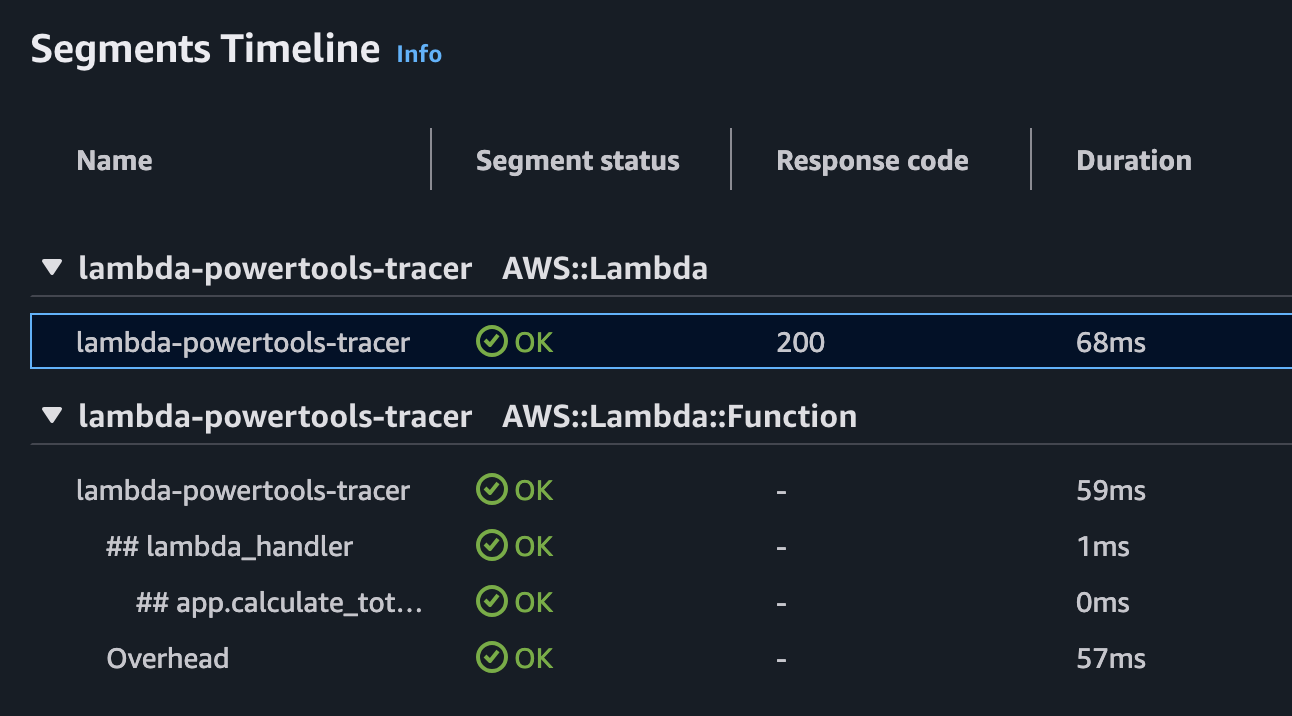
Select the trace with the longer duration and scroll down to the Segments Timeline section. This view breaks down the function’s execution, showing initialization time and individual segments. Because we used the @tracer.capture_method decorator on calculate_total_cost, it appears as a distinct subsegment.
Notice that the initialization phase accounts for the majority of the duration, confirming this was a cold start.
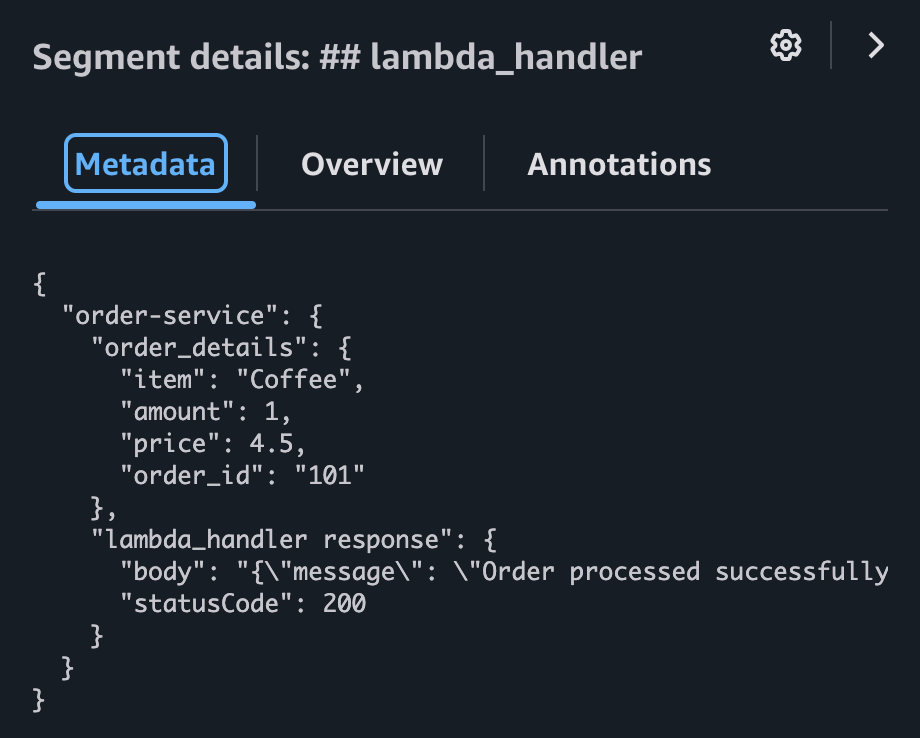
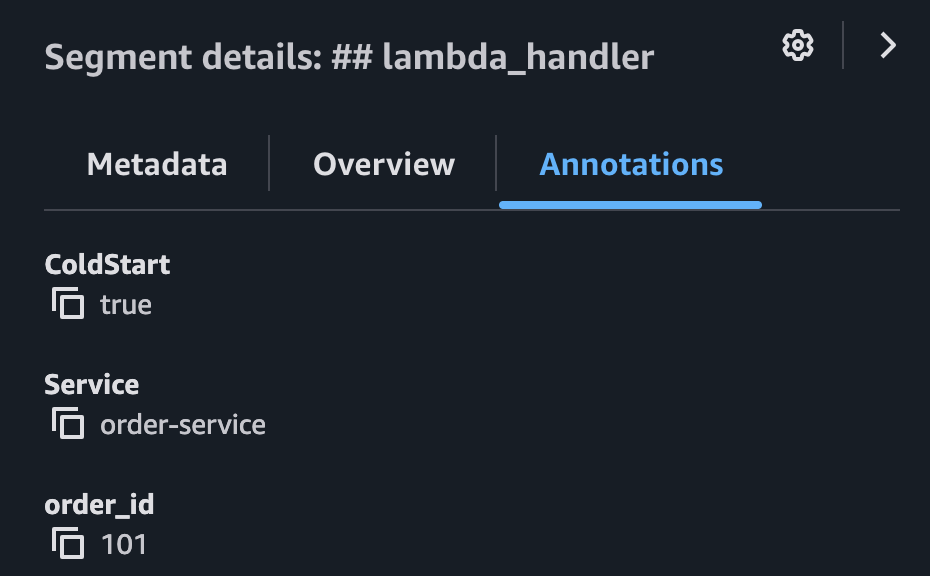
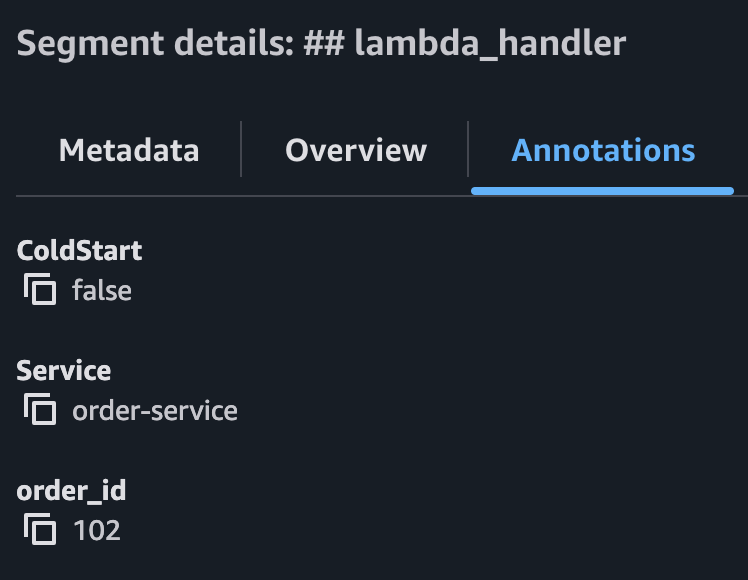
Clicking on the lambda_handler segment reveals the custom data we added. You can see the order_details in the metadata and the order_id in the annotations. The annotations also confirm that this execution included a cold start.
Return to the Traces list and select the second trace. You will observe a significantly shorter duration because the execution environment was already initialized (warm start).
Checking the annotations for the lambda_handler segment in this trace confirms that ColdStart is false.
#
Cleaning Up
Once you have verified the traces, remember to destroy the infrastructure to avoid incurring unnecessary costs.
#
Learn More
-
https://docs.aws.amazon.com/xray/latest/devguide/aws-xray.html ↩︎
-
https://docs.aws.amazon.com/powertools/python/latest/core/tracer/ ↩︎
-
https://docs.aws.amazon.com/powertools/python/latest/core/tracer/#synchronous-functions ↩︎
-
https://docs.aws.amazon.com/powertools/python/latest/core/tracer/#lambda-handler ↩︎
-
https://docs.aws.amazon.com/powertools/python/latest/core/tracer/#annotations-metadata ↩︎