Powertools for AWS Lambda (2) - Custom Metrics
Table of Contents
Metrics are a key component of monitoring and observability, allowing you to understand the behavior of your Lambda functions and identify potential issues. In this post, we will explore how to use AWS Lambda Powertools to simplify metric collection.
The complete source code for this example is available in this GitHub repository.
#
Metrics
Metrics collect data about your AWS resources, including Lambda functions,1 enabling you to monitor performance and pinpoint issues. AWS CloudWatch aggregates these metrics, providing visualizations to help you analyze your function’s behavior.
AWS Lambda Powertools offers a dedicated Metrics utility to simplify this process. In the example below, we will use the Metrics class to track application-specific data. The complete code can be found in lambda/app.py.
This example demonstrates how to track the number of successful orders, grouping them by item type. Every successful order will trigger a new metric entry.
import json

from aws_lambda_powertools import Metrics
from aws_lambda_powertools.metrics import MetricUnit
from aws_lambda_powertools.utilities.typing import LambdaContext

# ...

# A
metrics = Metrics()

# B
@metrics.log_metrics
def lambda_handler(event: dict, context: LambdaContext) -> dict:
    try:
        # ...

        # C
        metrics.add_metric(name="SuccessfulOrders", value=1, unit=MetricUnit.Count)
        metrics.add_dimension(name="item", value=event.item)
        metrics.add_metadata(key="request_id", value=context.aws_request_id)

        return {"statusCode": 200, "body": "..."}

    except Exception:
        # ...
        return {"statusCode": 500, "body": "..."}
##
A. Defining the Metrics Class
The Metrics class is the entry point for collecting metrics within your Lambda function.
##
B. Flushing Metrics
The @metrics.log_metrics decorator ensures that collected metrics are automatically flushed (sent to CloudWatch) when the request completes or fails.
##
C. Adding Metrics, Dimensions, and Metadata
metrics.add_metric: Adds a new metric to the buffer. Theunitparameter specifies the metric type (e.g.,Count,Seconds). Here, we useCountto track successful orders.metrics.add_dimension: Adds a dimension to the metric. Dimensions are key-value pairs used for filtering and aggregating metrics. In this example, we add anitemdimension to group metrics by the item ordered.2metrics.add_metadata: Attaches metadata to the metric. Unlike dimensions, metadata is high-cardinality data useful for debugging but not for aggregation. We include therequest_idto trace specific requests.3
Metrics in CloudWatch are grouped by Namespace.4 For this service, we use the order-service namespace. You can define this namespace via the POWERTOOLS_METRICS_NAMESPACE environment variable in terraform/lambda.tf (recommended) or directly in the code using metrics = Metrics(namespace="order-service").
resource "aws_lambda_function" "lambda" {
  ...
  environment {
    variables = {
      # ...
      POWERTOOLS_METRICS_NAMESPACE = "order-service"
    }
  }
  ...
}
#
Deploying and Testing
Deploy the function using the standard Terraform workflow (terraform init, terraform apply). Once deployed, open the AWS Lambda console and invoke the function with these test events:
{
  "order_id": "101",
  "item": "Coffee",
  "amount": 1,
  "price": 4.50
}
{
  "order_id": "102",
  "item": "Coffee",
  "amount": 3,
  "price": 4.50
}
{
  "order_id": "103",
  "item": "Sandwich",
  "amount": 1,
  "price": 8.99
}
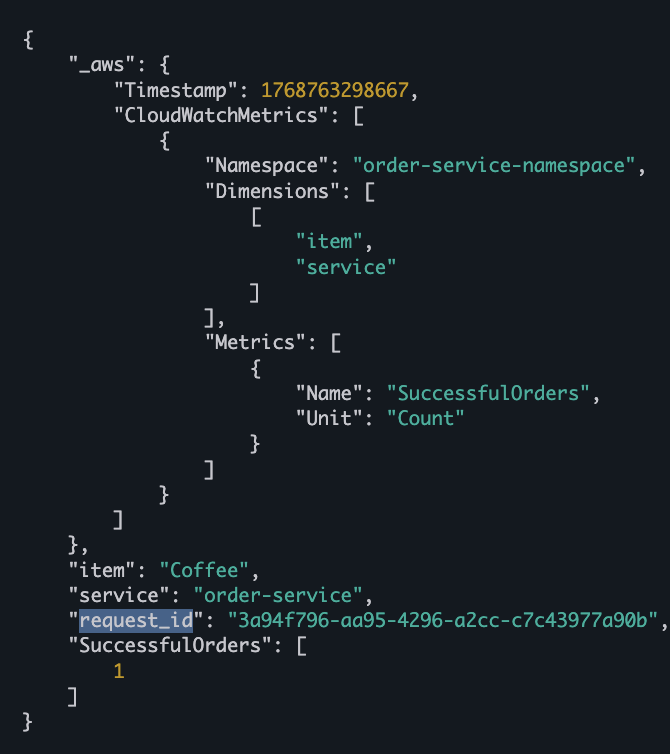
After running the tests, examine the CloudWatch logs. You should see entries for the SuccessfulOrders metric, which include the Namespace, Dimensions, and Metrics. The request_id metadata is also captured, providing a key identifier for tracing requests in a production system.
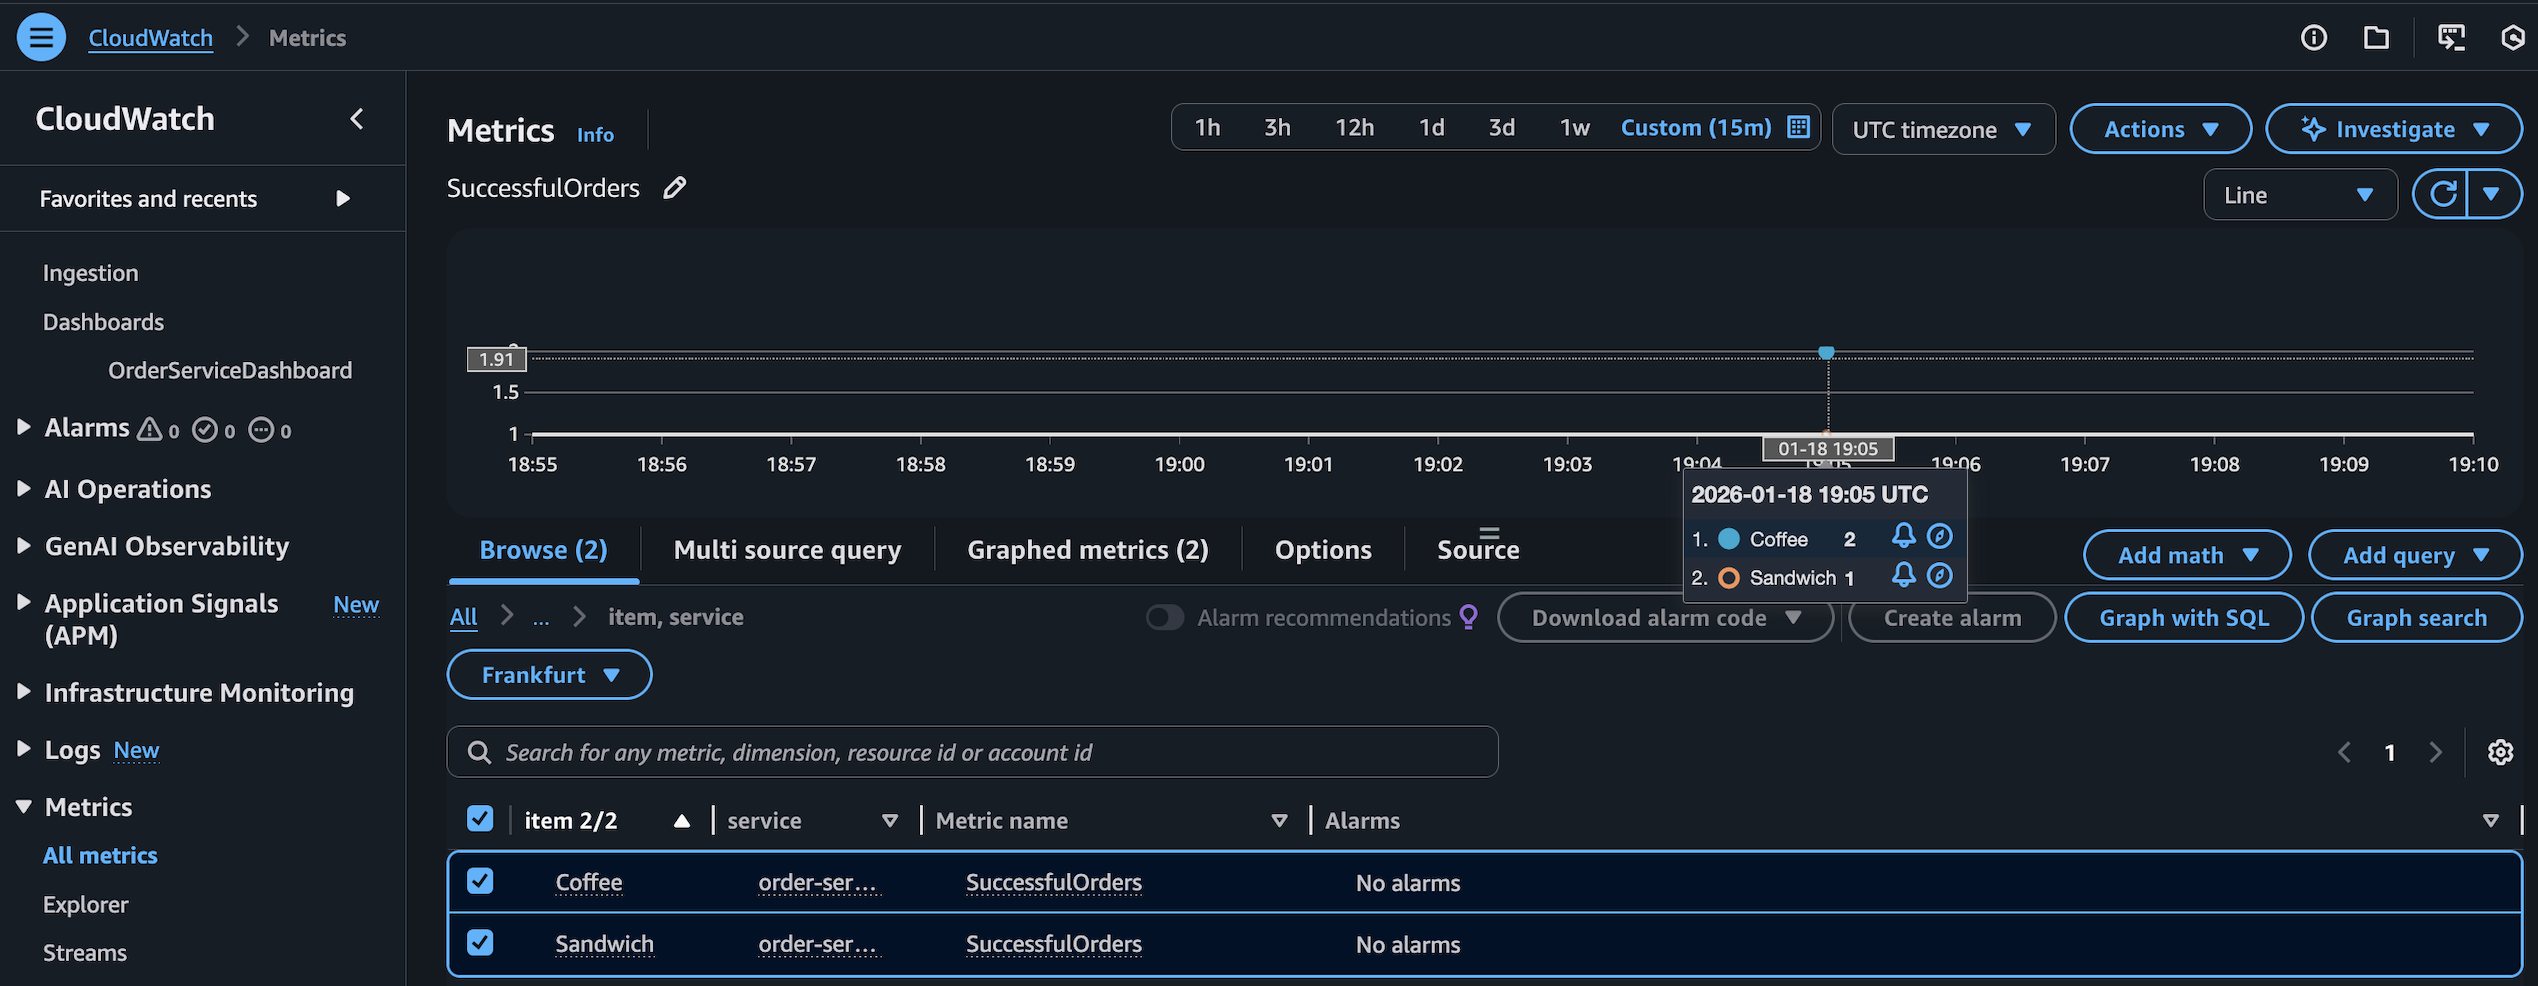
Next, navigate to the Metrics tab and select the order-service namespace. Since the first two events were for Coffee and the third for Sandwich, the SuccessfulOrders metric should reflect a count of 2 for Coffee and 1 for Sandwich.
#
Cleaning Up
Once you have confirmed the metrics are reporting correctly, remember to delete the resources to avoid incurring unnecessary costs.
#
Learn More
-
https://docs.aws.amazon.com/AmazonCloudWatch/latest/monitoring/cloudwatch_concepts.html#Metric ↩︎
-
https://docs.aws.amazon.com/AmazonCloudWatch/latest/monitoring/cloudwatch_concepts.html#Dimension ↩︎
-
https://docs.aws.amazon.com/powertools/python/latest/core/metrics/#adding-metadata ↩︎
-
https://docs.aws.amazon.com/AmazonCloudWatch/latest/monitoring/cloudwatch_concepts.html#Namespace ↩︎